Nov 2020 - Mar 2022

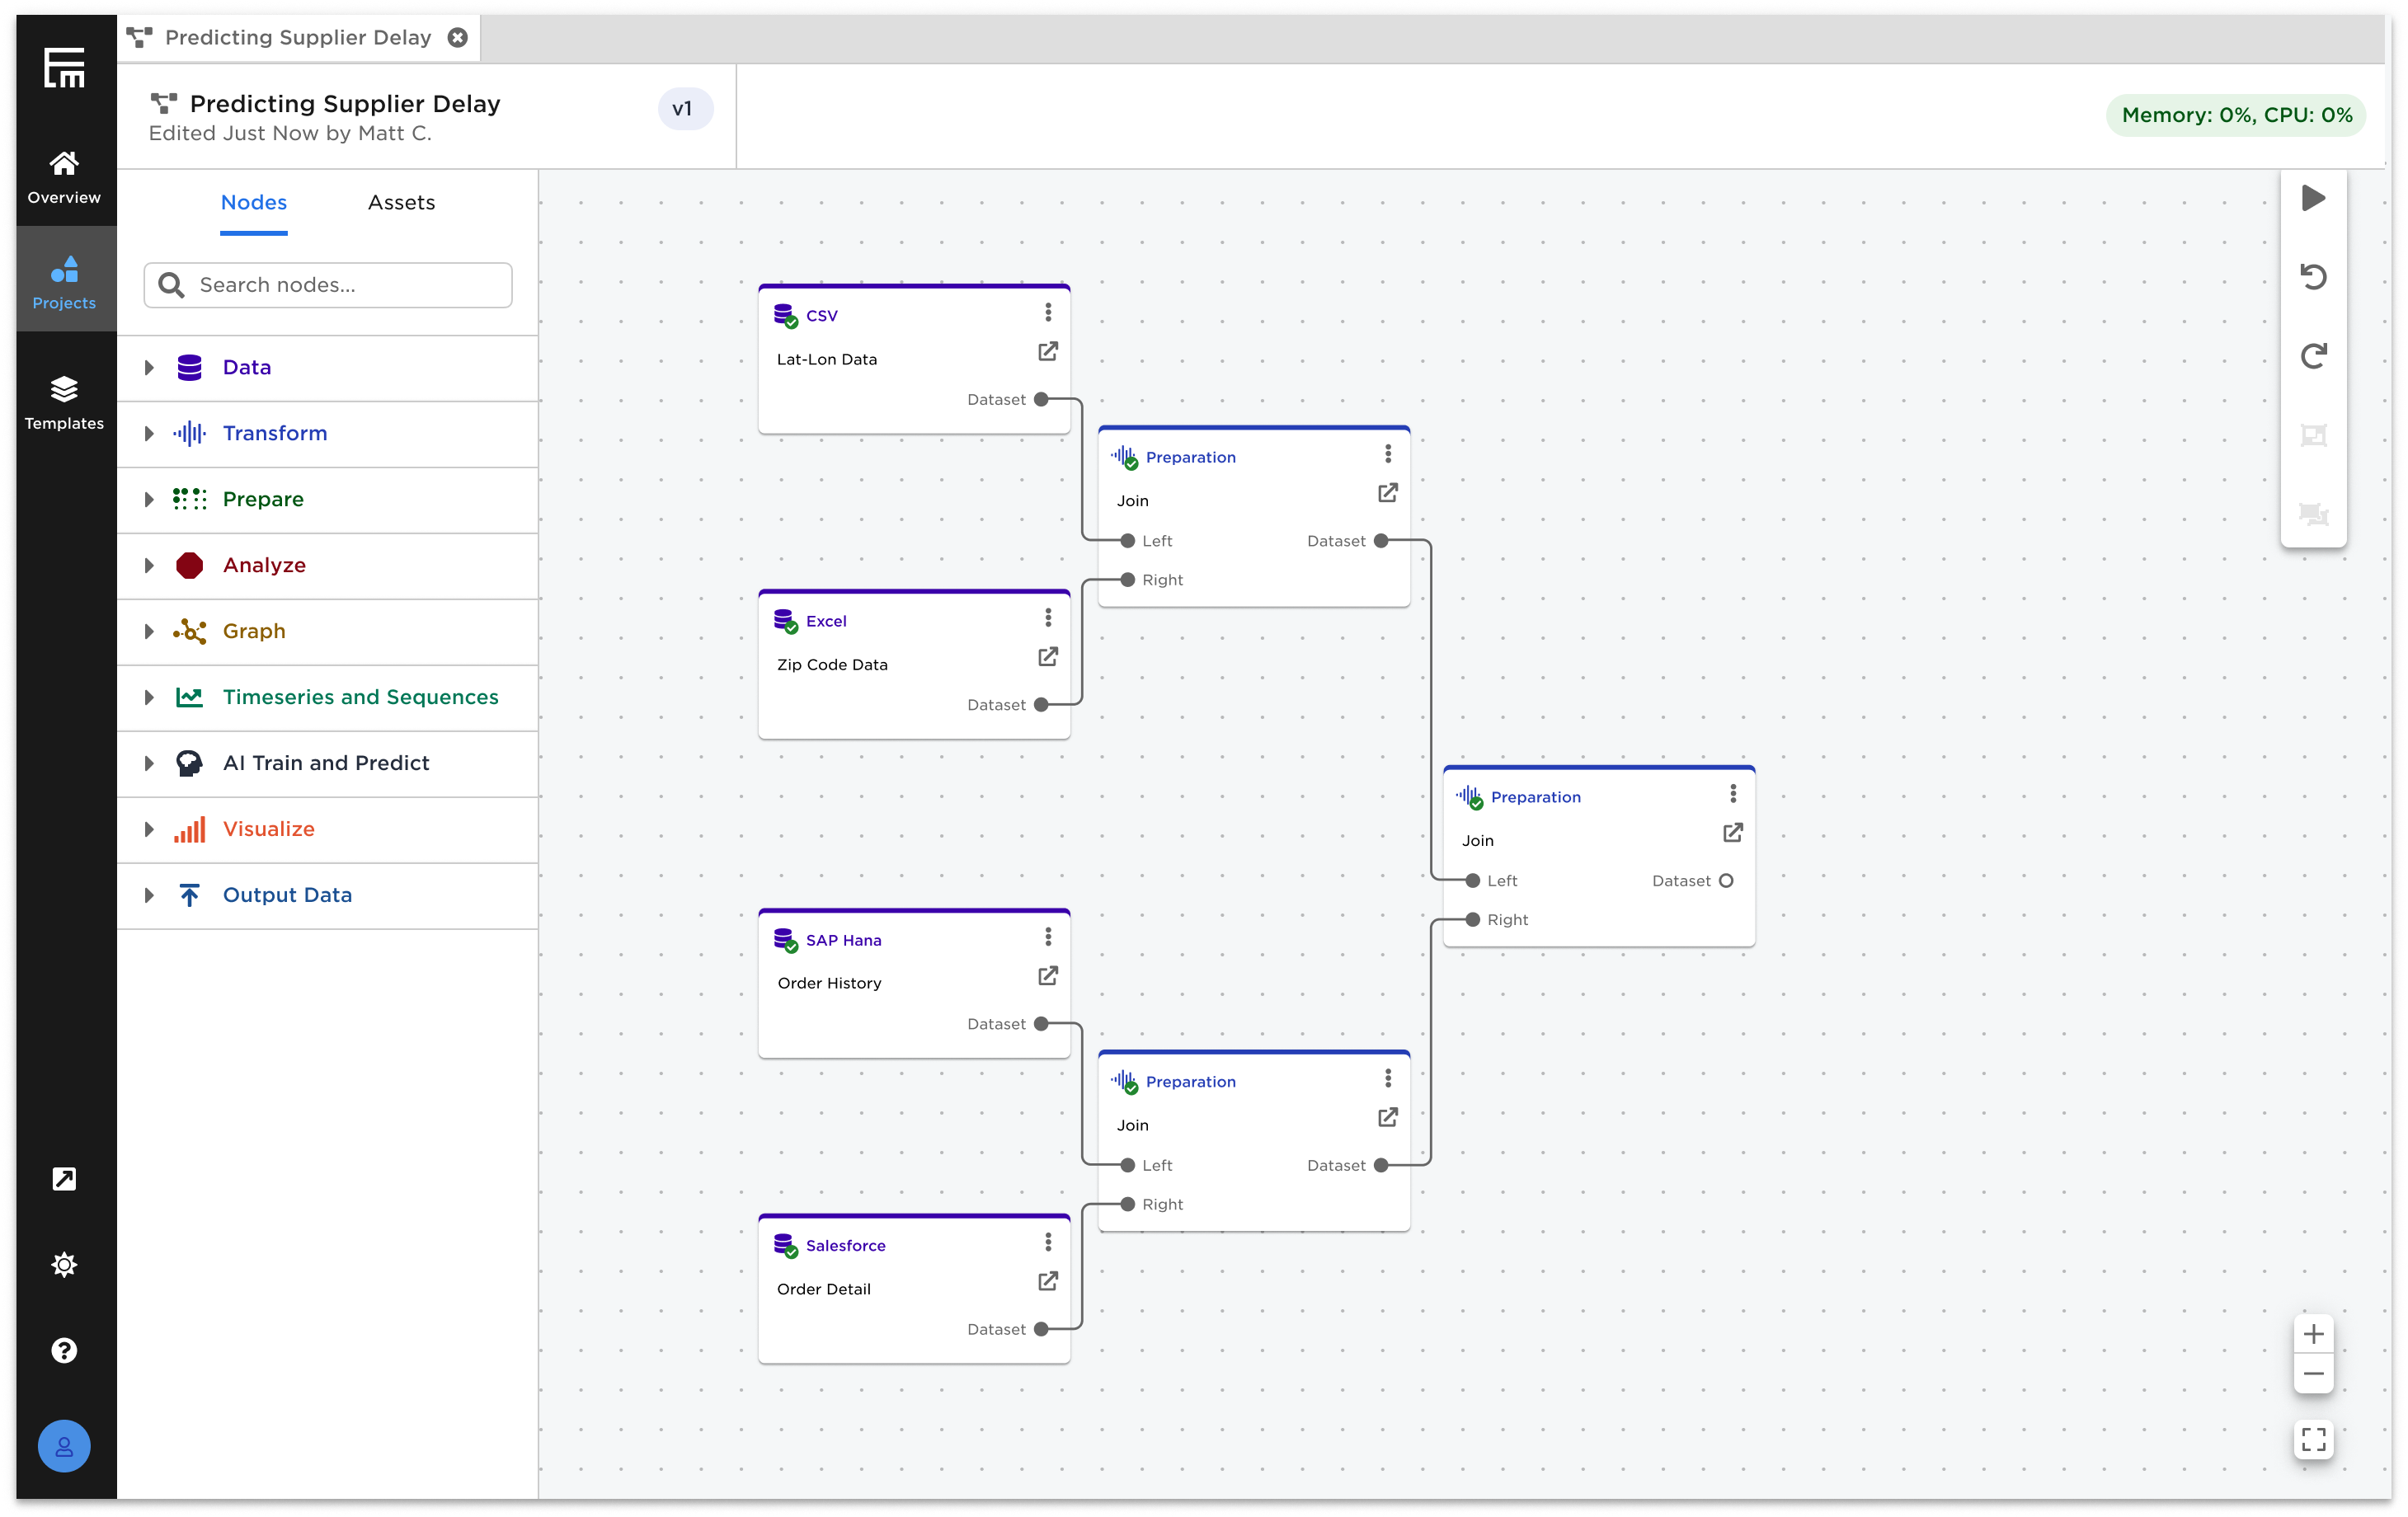
Visually Guided Machine Learning with Ex Machina

Summary

Ex Machina is a low-code data exploration and analytics tool for non-technical users (Data Analyst, Business Analyst, Strategy Associate, etc). Its primary goal is to help businesses with limited technical resources/expertise to understand their data and leverage lightweight machine learning functionality in a visually guided way.

Collaborators

Josh P. (Project Manager), Matt Connor (Project Manager), Lisa Xu (Designer)

Role and Responsibilities

Research and Design Lead
Primary and Secondary Research, User/Usability Testing, Heuristic Analysis, Affinity Diagramming, Concept Mapping, Low to high fidelity Design

Product Background

With the world’s data increasing exponentially every year, the ability to extract actionable insights from data is becoming increasingly more important.

As traditional data analytics grow outdated, the data science field has skyrocketed in popularity in recent years due to the more powerful insights data scientists can provide by cleaning and preparing data and identifying more granular patterns or trends through machine learning. However, data scientists remain in limited supply today, and many companies struggle to hire the high price point of a typical data scientist’s salary.

The Challenge

If not all companies have the luxury of affording a highly technical team of data scientists, how might we enable less technical data analysts to elicit valuable insights from their data with machine learning? 

What is Ex Machina?

C3 AI’s Ex Machina is a product meant to target the aforementioned need. Ex Machina is a no-code tool meant for ad-hoc data exploration, preparation, and analysis. The product supports a variety of powerful functions, from detailed data profiling, to various transformations (joining datasets, filtering values, dropping columns, etc), to statistical summaries (hypothesis testing with 1 or 2 sample means, standard deviation, etc).


The insights from Ex Machina (presented in data tables or a variety of visualizations) can be shared within teams and ultimately aims to make the workflow for users like Business Analyst and Strategy Associates faster and more intuitive.

While compelling in its use cases, Ex Machina is still a relatively young and rapidly growing product that has plenty of room to improve. Specifically, machine learning is a challenge to represent in a UI due to its technical nature and nuances in training configuration.

Research Phase

Planning

With the focus on making machine learning more accessible and intuitive for non technical users, my team and I created a research plan to document our goals and assumptions. We investigated the domain from multiple angles: primary research interviews, competitive analysis on similar products, and reviewing pain points from customers on the initial Ex Machina experience.

Initial Insights

Iteration Overview

Ideation

Based on the initial insight direction, our team began brainstorming new concepts for how we could successfully abstract technically complex information while still maintaining user understanding of core actions. We continued to review these concepts with internal and external users (both technical and non-technical) to iterate on functionality and concept feedback.

These concepts were based around AutoML, a handy technology that automatically tests and trains multiple models and surfaces the highest performing model (in the context of that modeling problem’s validation metric), such that the user does not need to manually experiment with different models themself. For the non-technical analyst users we were searching for, AutoML enabled powerful functionality for our team to build UI on top of.

Design Challenges - ML Training Setup

Ex Machina's initial ML configuration panel lacked user guidance for inputs and contained overly technical terms, confusing most users who attempted to interact with it.

After several rounds of design iterations and user validation, we tried to ensure that simplicity was one of our core design principles. By dividing clear sections for input categories, incorporating progressive disclosure for advanced inputs, and providing clearer tooltips, users were able to feel more guided through the experience.

Before

After

Design Challenges - ML Results

After training their AutoML training jobs, several users noted that they had no idea how to interpret the results of the model. The initial view showed technical model scores in a data table format, leaving users unclear on how to proceed next.

The new results view is split into two views: the Model Trial Leaderboard (automated different attempts at optimizing the model score) and the Performance Results of the top performing model. Since we didn't want to completely erase the important technical details of the model performance, we created a separate "Performance Metrics" tab for more advanced users to interpret metrics and visualizations.

Before

After

Design Challenges - Visualization Chart Type Selection

While less inherently technically complex, the visualization creation process also proved to have many hiccups in the user experience. First, the selection of the visualization chart type lacked discoverability and guidance for the user.

In order to keep this node's panel pattern as consistent with that of other Ex Machina nodes, we moved the chart selection into the main configuration panel. To combat the understanding issue, we added short explanations and icons for each chart type to help guide the user on which one might fit their use case.

Before

After

Design Challenges - Visualization Setup

The original configuration for the chart axes received a lot of criticism due to the overlapping terminology and lack of guidance with the data inputs. While these terms made sense in the context of performing certain ad-hoc queries or calculations, many users struggled to properly setup their charts.

We wanted the improved experience to be as visually-driven as possible, so the experience could be intuitive for both beginner and advanced users. The new setup provided draggable "cells" that represented columns of the dataset, each marked with an icon representing the data type of the column. Users are able to drag and drop the columns they're looking to visualize directly onto the blank chart to create their charts.

Before

After

Adaptive to Different Models

Every machine learning challenge is unique. The specific scores and visualizations that appear at the Selected Model Performance Results are determined by the type of modeling approach and algorithm (i.e. for a Regression AutoML node, the validation metric may be Mean Squared Error [MSE], while Classification might prioritize F1 Score).

Top Row, left to right: Model Performance Results for a Classification Model with ROC/PR Curves (i.e. Logistic Regression Model), Classification Model with Confusion Matrix (i.e. Random Forest Model), Clustering Model with Cluster Centroids and Silhouette Plot (i.e. K-Means Model)

Bottom Row, left to right: Model Performance Results for a Regression Model with R Squared visualization (i.e. ARIMA model), Regression Model with AIC information (i.e. ARIMA model), Clustering Model with histogram plot of mean length (i.e. Isolation Forest Model)

Promoting User Guidance

The importance of guidance and explainability in the machine learning functionality sparked a broader effort to enhance user guidance throughout multiple stages of the product. This guidance ranges from simple tooltips to full in-product documentation for nodes. Below are some examples of different levels in the product where Ex Machina attempts to explain various concepts to the user.